The Practice Results Report widget shows the results for all the groups that have taken the practice exam you chose. Their results are distributed in a chart and a table.
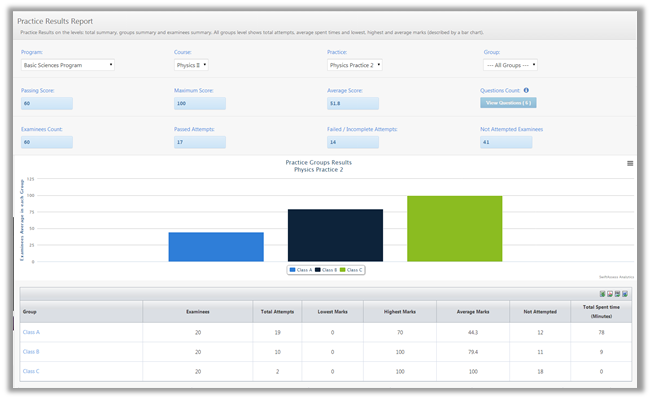
Practice Groups Results Chart
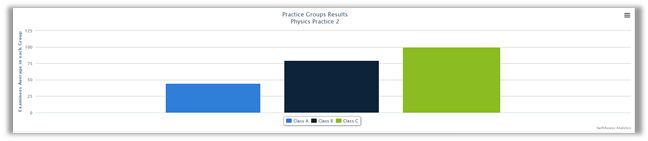
•The chart shows the examinees average in the particular group that you have chosen.
•It can be printed, exported as an image (PNG/JPEG), PDF document, and SVG vector image by clicking on ![]()
Practice Groups Results Table
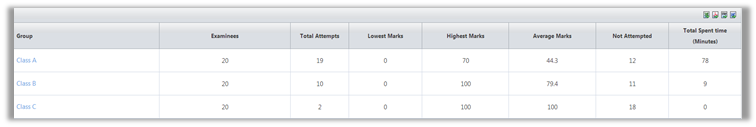
•The table consists of several headers that convey information about the group that you have chosen. Those information include:
o"Examinees"
o"Total Attempts"
o"Failed Count"
o"Average Marks"
o"Median Marks"
o"Not Attempted"
•The table can be exported to Excel, PDF, CSV, and Word.
•Click on the Group's name (e.g in this case it is "Class A"), which will take you to examinees' results for that particular group.
See Also
SwiftAssess © 2021