This section helps you to view the analysis of questions in a certain assessment.
1.Choose a program from the drop down list.
2.Choose a course from the dropdown list.
3.Choose an assessment for the dropdown list.
4.A chart and a table of the list will appear. Both contain question performance comparison in terms of P-value and Correlation Discrimination.
.gif)
•A P-Value is a value that is between 1 and 0. The more a P-Value is close to 1, the easier the question is.
•Correlation Discrimination is a value that indicates how much the question discriminates between the examinees level. The more it is close to 1, the better it is at discrimination.
click on a question title from the table. It will lead you to further details os that question and how it is performed throughout the assessment. For instance, if you click the question with the title “Drag the circuit elements to their positions”, you will see a further breakdown of its details.
.gif)
•An overview of the question shows its title, description, type, difficulty, to which lesson it belongs and question marks.
.png)
•Click on ![]() to see the question, as in "Preview a Question" section.
to see the question, as in "Preview a Question" section.
•Since this question is not choice-based, the table will show the percentages of how many answered it correctly, incorrectly, and how many did not answer.
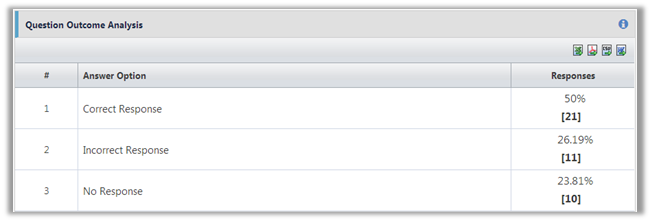
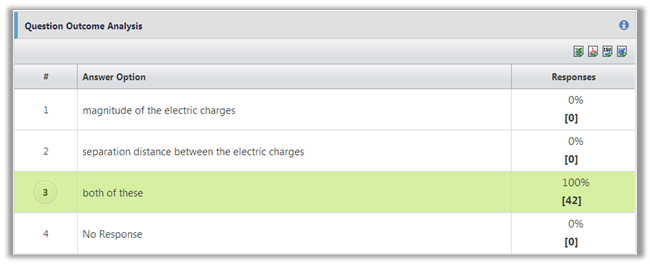
If the question was choice-based, (e.g Multiple Select/Multiple Choice/True or False) the table would indicate the correct answer.
•The panel to the right shows highlight information.
.png)
o"Question P-value", which is a value between 0 and 1 that indicates the difficulty of a question. The close it is to 1, the easier the question.
o"Discrimination", which is a value that indicates how much the question discriminates between the examinees level. The more it is close to 1, the better it is at discrimination.
o"Average Duration", which is the amount of time taken for the selected question.
o"Minimum marks" indicates the lowest grade obtained by an examinee for this question.
o"Maximum marks" indicates the highest grade obtained by an examinee for this question.
oA chart that illustrates the question marks relative to the total marks of the assessment
o"Total Presented" indicates the total number of examinees who received this question.
o"Total Responses" indicates the total number of examinees who responded this question.
oA chart that illustrates how many answered incorrectly as opposed to how many answered correctly.
See Also
SwiftAssess © 2021