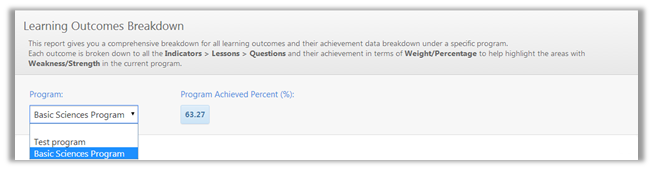
This section helps you to understand the analytics of Program Results and gives you instructions about how to use its options. You can view the results of a certain program by choosing a program from the drop down list.
|
|
The programs that will appear in the drop down list are the published, outcome-based programs only. |
The overall percent of the program achieved will then appear and it indicates how much the outcomes of the program have been achieved.
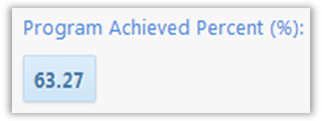
A further breakdown of the results will be loaded into a chart and a table underneath.
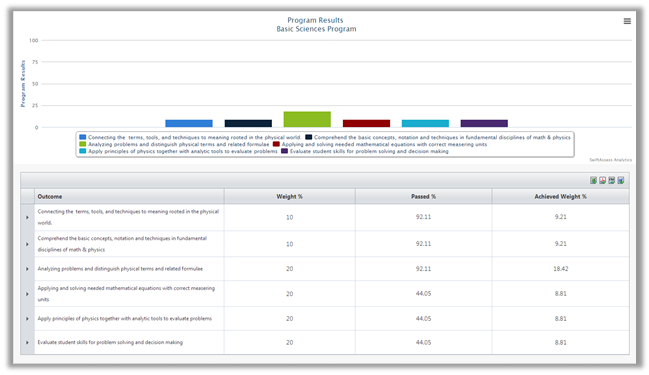
Program Results Chart
The outcomes that were specified for the program will appear in the chart. Each outcome is assessed in the chart by how much in percentages it has been achieved. The figure below shows the different outcomes that appear in the chart with a brief explanation.

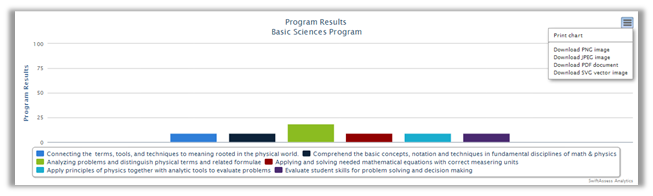
Since the current program chosen has 6 outcomes, the chart will contain 6 bars. The chart can be printed, exported as an image (PNG/JPEG), PDF document, and SVG vector image.
Table
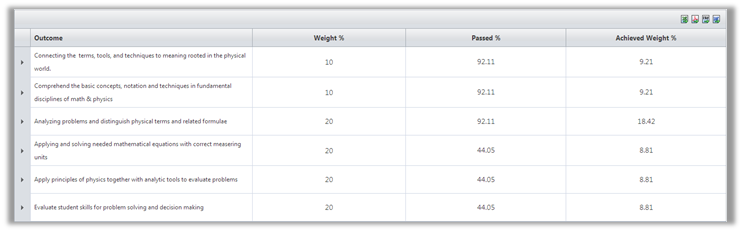
The table shows the same learning outcomes indicated in the chart. Since our program has 6 outcomes, the table will show 6 rows. For each outcome, the table shows the following:
•"Weight" of the outcome (in percentages).
•Percentage of students who "Passed" this outcome.
•"Achieved Weight", which indicates how much of the outcome's total weight has been achieved (in percentages).
|
|
The sum of the total weights is always 100% |
The table can be exported to Excel, PDF, CSV, and Word.
Notice that there is an ![]() to the left of each row. It indicates that the outcome can be inspected in further details. Click on
to the left of each row. It indicates that the outcome can be inspected in further details. Click on ![]() to move to the next sub-levels of the table.
to move to the next sub-levels of the table.
Sub-level 1
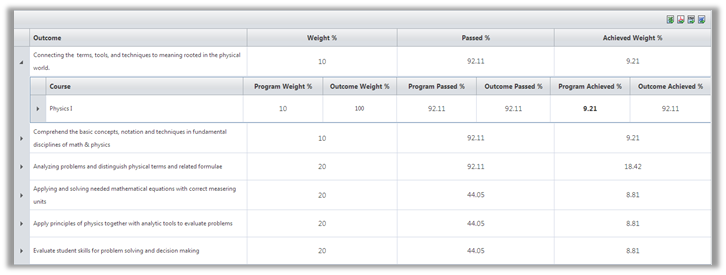
This level shows information about the course(s) that is (are) related to the outcome. It indicates the basis in which the results for the outcome were decided. It contains the following headers:
•"Program Weight", which shows how much of the program weight relies on this course.
•"Outcome Weight", which shows how much of the outcome is distributed for this course (100% because it's the only course there)
•"Program Passed", indicates how many in percentage passed the program.
•"Outcome Passed", indicated how many in percentage passed the outcome.
•"Program Achieved", indicates how much of the program weight was achieved.
•"Outcome Achieved", indicates how much of the outcome weight was achieved.
Sub-level 2
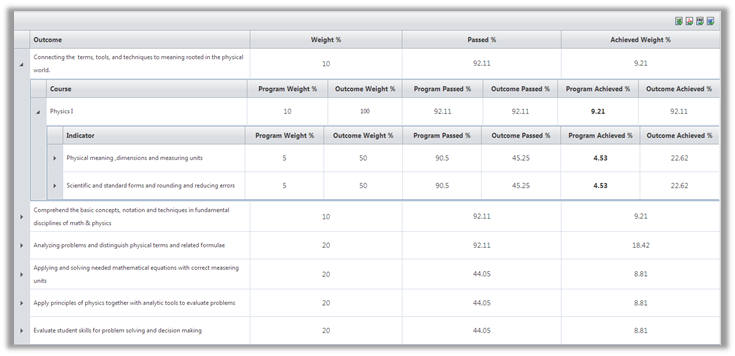
This sub-level shows indicators related to the course in sub-level 1. It indicates the basis in which the results for the program were decided. It contains the same headers as Sub-level 2.
•"Indicator", which shows the indicators related to the outcome.
•"Program Weight", which shows how much of the program weight relies on it.
•"Outcome Weight", which shows how much of the outcome weight relies on it.
•"Program Passed", which shows how many passed the program under that indicator.
•"Outcome passed" which shows how many passed that outcome under that indicator.
•"Program achieved" shows how much that indicator contributed towards that learning outcome.
•"Outcome achieved"shows how much that outcome was achieved under the program.
Sub-level 3
This sub-level contains the exams and their question titles that assessed the indicator in sub-level 2. It contains the following headers:
•"Exam Name"
oClick on the exam to view detailed results, as in the "Exam Results" report.
•"Question Title" that is connected to the indicator.
oClick on question title to view detailed analysis, as in the "Question Analysis" report.
•"Question Type"
•"Passed Percent", which indicates how many answered it correctly.
See Also
SwiftAssess © 2021