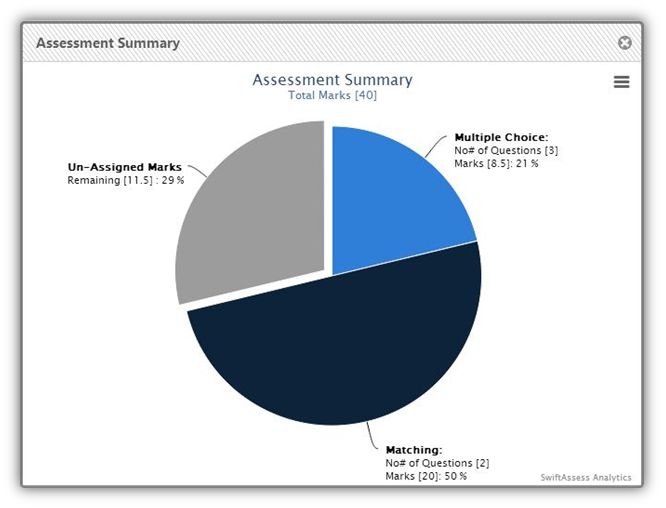
The summary chart of an assessment illustrates the division of the questions types and the marks distribution. The summary chart is important because it shows the number of questions of a certain type, the mark assigned to that type, and its percent from the total mark of the assessment. This helps you decide whether you need to add more questions of a certain type or rearrange the marks distribution.
You can view the assessment summary by clicking ![]() in the Assessment Question Summary widget.
in the Assessment Question Summary widget.
See Also
•Assign a New Assessment Question
SwiftAssess © 2021